Prediction
0 - load libary
1 - Load model
2 - Predict with model
3 - Avoid obstacle
0 - load libary
# Import the necessary packages

# for the Haralick descriptor
import mahotas

# Classifier
from sklearn.svm import LinearSVC

# To save and load, the model that is created from the classification
from sklearn.externals import joblib

import matplotlib.pyplot as plt
import numpy as np
import argparse
import imutils
import cv2
1 - Load image of "ocean" and "other"
def resizeImage(image):
    (h, w) = image.shape[:2]

    width = 360  #  This "width" is the width of the resize`ed image
    # calculate the ratio of the width and construct the
    # dimensions
    ratio = width / float(w)
    dim = (width, int(h * ratio))
    resized = cv2.resize(image, dim, interpolation=cv2.INTER_AREA)
    #resized = cv2.resize(image, dim, interpolation=cv2.INTER_CUBIC)
    return resized
1 - Load model
# loadModel
model = joblib.load("model/filename_model.pkl")
2 Predict with the model
-
go thru all the squares and extract the feature vector
-
used .predict
-
mask the square if prediction == "other"
-- Return masked image
# Feature extraction
class Haralick:
    # this mehtod is a Harlick discriptor
    # it uses the mahotas library

    def describe(self, image, eps=1e-7):
        # it should send in a grayscale image in the describe function
        #extract Haralick texture features in 4 directions, then take the
        # mean of each direction
        # ignore_zeros=True since i have masked the image, and therefore we want to ignore black color == 0 (zeroes)
        features = mahotas.features.haralick(image, ignore_zeros=True).mean(axis=0)

        # return the haralick feature
        return features
def predictMaskedImage(image):
# get the descriptor class initiated
#desc = LocalBinaryPatterns(10, 5)
desc = Haralick()
imageROIList = []
predictionList = []
centerList = []
# This mask has the same width and height a the original image and has a default value of 0 (black).
maskedImage = np.zeros(image.shape[:2], dtype="uint8")
########### create imageROIList here ############
(h, w) = image.shape[:2]
# Divide the image into 100 pieces
cellSizeYdir = h / 10
cellSizeXdir = w / 10
# start in origo
x = 0
y = 0
counterInt = 0
#######################################
# 10*10 = 100
for i in xrange(10):
# update this value
y = cellSizeYdir * (i)
x = 0 # it starts at 0 for a new row
for j in xrange(10):
#print "[x] inspecting imageROI %d" % (counterInt)
counterInt = counterInt + 1
x = cellSizeXdir * (j)
imageROI = image[y: cellSizeYdir * (i+1), x:cellSizeXdir * (j+1)]
#print "ystart " + str(y) + " yjump " + str((cellSizeYdir * (i+1)))
#print "xstart " + str(x) + " xjump " + str((cellSizeXdir * (j+1)))
centerPos = ( cellSizeXdir * (j+1) - (cellSizeXdir)/2, cellSizeYdir * (i+1) - (cellSizeYdir)/2)
centerList.append(centerPos)
#########################################
# grayscale and calculate histogram
grayImageROI = cv2.cvtColor(imageROI, cv2.COLOR_BGR2GRAY)
hist = desc.describe(grayImageROI)
# need prediction to mask image
#model = model
if model == None:
print "it was none"
# reshape the histogram to work with sci kit learn
histNew = np.reshape(hist, (1, len(hist)))
prediction = model.predict(histNew)[0]
predictionList.append(prediction)
#prediction = model.predict(hist)[0]
#predictionList.append(prediction)
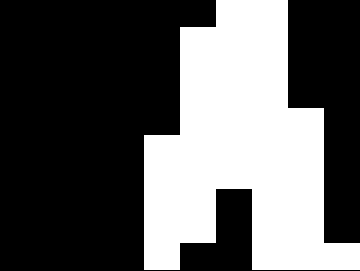
# HERE the returned maskedImage is created
# construct a mask for the segment
if prediction == "other":
maskedImage[y:y + cellSizeYdir, x:x + cellSizeXdir] = 255
if prediction == "ocean":
maskedImage[y:y + cellSizeYdir, x:x + cellSizeXdir] = 0
return maskedImage, predictionList, centerList
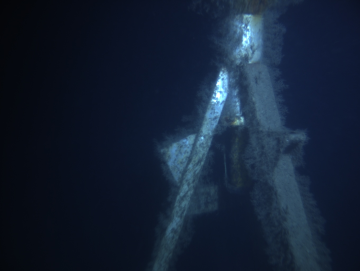
# load image to predict

path = r"trainingIMG/test.jpg"
imageTest = cv2.imread(path)

# 2 resize the image
imageTest = resizeImage(imageTest)

cv2.imshow("testimage", imageTest )
cv2.waitKey(0)

maskedImage, predictionList, centerList = predictMaskedImage(imageTest)

cv2.imshow("maskedImage", maskedImage )
cv2.waitKey(0)

# save the image
cv2.imwrite("docsIMG/maskedImage_haralick.png", maskedImage)
cv2.imwrite("docsIMG/imageTest.png", imageTest)
True
The images displayed
Make fancy figure to display the prediction
# create the 3D grayscale image --> so that I can make color squares for figures to the thesis
# This does not change the histograms created.
#stacked = np.dstack([gray] * 3)
image_predicted = imageTest.copy()
# Divide the image into 100 pieces
(h, w) = image_predicted.shape[:2]
cellSizeYdir = h / 10
cellSizeXdir = w / 10
# Draw the box around area
# loop over the x-axis of the image
for x in xrange(0, w, cellSizeXdir):
# draw a line from the current x-coordinate to the bottom of
# the imagez
#cv2.line(image_predicted, (x, 0), (x, cellSizeXdir * (j + 1)), (0, 255, 0), 1)
cv2.line(image_predicted, (x, 0), (x, h), (0, 255, 0), 1)
#
# loop over the y-axis of the image
for y in xrange(0, h, cellSizeYdir):
# draw a line from the current y-coordinate to the right of
# the image
cv2.line(image_predicted, (0, y), (w, y), (0, 255, 0), 1)
# draw a line at the bottom and far-right of the image
cv2.line(image_predicted, (0, h - 1), (w, h - 1), (0, 255, 0), 1)
cv2.line(image_predicted, (w - 1, 0), (w - 1, h - 1), (0, 255, 0), 1)
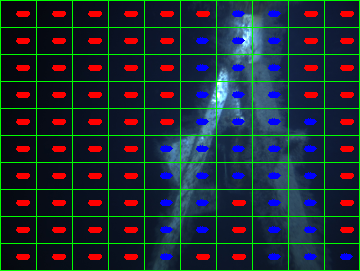
# put the prediction text on top
# show the output of the prediction with text
print len(predictionList)
print len(centerList)
for (i, predVal) in enumerate(predictionList):
CORD = centerList[i]
if predictionList[i] == "other":
colorFont = (255, 0, 0) # "Blue color for other"
else:
colorFont = (0, 0, 255) # "Red color for ocean"
# textOrg = CORD
# textOrg = tuple(numpy.subtract((10, 10), (4, 4)))
testOrg = (40, 40) # need this for the if statment bellow
# for some yet unknown reason CORD does sometime contain somthing like this [[[210 209]] [[205 213]] ...]
# the following if statment is to not get a error becouse of this
if len(CORD) == len(testOrg):
# textOrg = tuple(np.subtract(CORD, (12, 0)))
textOrg = CORD
cv2.putText(image_predicted, predictionList[i], textOrg, cv2.FONT_HERSHEY_SIMPLEX, 0.1, colorFont, 3)
else:
pass
# show the image_predicted here
cv2.imshow("image_predicted", image_predicted)
cv2.waitKey(0)
# save image
cv2.imwrite("docsIMG/image_predicted_haralick.png", image_predicted)
100
100


True
The image displayed