Prediction
0 - load libary
1.1 - Load model
1.2 - load test image
2 - Predict using model
# Import the necessary packages

# for the lbp
from skimage import feature

# Classifier
from sklearn.svm import LinearSVC

# to save and load, the model that is created from the classification
from sklearn.externals import joblib

import matplotlib.pyplot as plt
import numpy as np
import argparse
import imutils
import cv2
def resizeImage(image):
    (h, w) = image.shape[:2]

    width = 360  #  This "width" is the width of the resize`ed image
    # calculate the ratio of the width and construct the
    # dimensions
    ratio = width / float(w)
    dim = (width, int(h * ratio))
    resized = cv2.resize(image, dim, interpolation=cv2.INTER_AREA)
    #resized = cv2.resize(image, dim, interpolation=cv2.INTER_CUBIC)
    return resized
1.1 - Load model
# loadModel
model = joblib.load("model/filename_model.pkl")
2 Predict with the model
-
go thru all the squares and extract the feature vector
-
used .predict
-
mask the square if prediction == "other"
-- Return masked image
# Feature extraction
class LocalBinaryPatterns(object):
    # this class is from: http://www.pyimagesearch.com/2015/12/07/local-binary-patterns-with-python-opencv/
    def __init__(self, numPoints, radius):
        # store the number of points and radius
        self.numPoints = numPoints
        self.radius = radius

    def describe(self, image, eps=1e-7):
        # Compute the Local Binary Pattern representation
        # of the image, and then use the LBP representation
        # to build the histogram of patterns
        lbp = feature.local_binary_pattern(image, self.numPoints, self.radius, method= "uniform" ) # method= "ror") #method="var")# method="nri_uniform")  # method="uniform")
        # using unifrom binary pattern (watch this to understand better): https://www.youtube.com/watch?annotation_id=annotation_98709127&feature=iv&src_vid=wpAwdsubl1w&v=v-gkPTvdgYo
        # different merhod= --> http://scikit-image.org/docs/dev/api/skimage.feature.html?highlight=local_binary_pattern#skimage.feature.local_binary_pattern
        (hist, _) = np.histogram(lbp.ravel(),
            bins=np.arange(0, self.numPoints + 3),
            range=(0, self.numPoints + 2))

        # Normalize the histogram
        hist = hist.astype("float")
        hist /= (hist.sum() + eps)

        # return the histogram of Local Binary Patterns
        return hist
def predictMaskedImage(image):

    # get the descriptor class initiated
    desc = LocalBinaryPatterns(10, 5)

    imageROIList = []
    predictionList = []
    centerList = []

    # This mask has the same width and height a the original image and has a default value of 0 (black).
    maskedImage = np.zeros(image.shape[:2], dtype="uint8")
    ########### create imageROIList here ############

    (h, w) = image.shape[:2]

    # Divide the image into 100 pieces
    cellSizeYdir = h / 10
    cellSizeXdir = w / 10

    # start in origo
    x = 0
    y = 0
    counterInt = 0

    #######################################

       # 10*10 = 100
    for i in xrange(10):

        # update this value
        y = cellSizeYdir * (i)

        x = 0 # it starts at 0 for a new row
        for j in xrange(10):
            # print "[x] inspecting imageROI %d" % (counterInt)
            counterInt = counterInt + 1

            x = cellSizeXdir * (j)

            imageROI = image[y: cellSizeYdir * (i+1), x:cellSizeXdir * (j+1)]

            #print "ystart  " + str(y) + "  yjump  " + str((cellSizeYdir * (i+1)))
            #print "xstart  " + str(x) +  "  xjump  " + str((cellSizeXdir * (j+1)))


            centerPos = (   cellSizeXdir * (j+1) - (cellSizeXdir)/2, cellSizeYdir * (i+1) - (cellSizeYdir)/2)
            centerList.append(centerPos)

            #########################################

            # grayscale and calculate histogram
            grayImageROI = cv2.cvtColor(imageROI, cv2.COLOR_BGR2GRAY)
            hist = desc.describe(grayImageROI)

            # need prediction to mask image
            #model = model
            if model == None:
                print "it was none"

            # reshape the histogram to work with sci kit learn
            histNew = np.reshape(hist, (1, len(hist)))

            prediction = model.predict(histNew)[0]
            predictionList.append(prediction)

            #prediction = model.predict(hist)[0]
            #predictionList.append(prediction)

            # HERE the returned maskedImage is created
            # construct a mask for the segment
            if prediction == "other":
                maskedImage[y:y + cellSizeYdir, x:x + cellSizeXdir] = 255

            if prediction == "ocean":
                maskedImage[y:y + cellSizeYdir, x:x + cellSizeXdir] = 0

    return maskedImage, predictionList, centerList
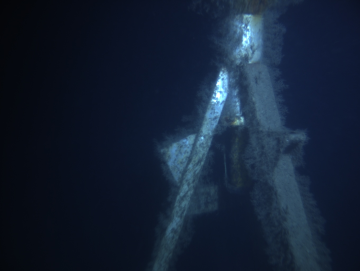
1.2 load image to predict
# 1.2 load image to predict

path = r"trainingIMG/test.jpg"
imageTest = cv2.imread(path)

# 2 resize the image
imageTest = resizeImage(imageTest)

#cv2.imshow("testimage", imageTest )
#cv2.waitKey(0)

cv2.imwrite("docsIMG/imageTest.png", imageTest)
True
Display testing image
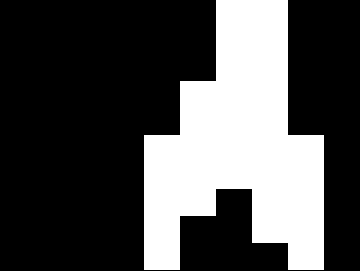
2 predict using model
# 2 predict using model

maskedImage, predictionList, centerList = predictMaskedImage(imageTest)

#cv2.imshow("maskedImage", maskedImage )
#cv2.waitKey(0)

# save image

cv2.imwrite("docsIMG/maskedImage.png", maskedImage)
True
Display maskedImage image
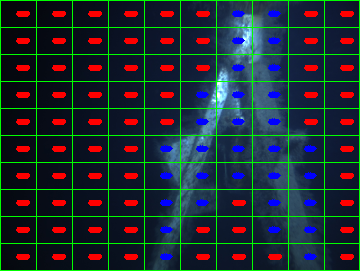
Make fancy figure to look cool in your theisis!!
# create the 3D grayscale image --> so that I can make color squares for figures to the thesis
# This does not change the histograms created.
#stacked = np.dstack([gray] * 3)

image_shit = imageTest.copy()

# Divide the image into 100 pieces
(h, w) = image_shit.shape[:2]
cellSizeYdir = h / 10
cellSizeXdir = w / 10

# Draw the box around area
# loop over the x-axis of the image
for x in xrange(0, w, cellSizeXdir):
    # draw a line from the current x-coordinate to the bottom of
    # the imagez
    cv2.line(image_shit, (x, 0), (x, h), (0, 255, 0), 1)
    #
# loop over the y-axis of the image
for y in xrange(0, h, cellSizeYdir):
    # draw a line from the current y-coordinate to the right of
    # the image
    cv2.line(image_shit, (0, y), (w, y), (0, 255, 0), 1)

# draw a line at the bottom and far-right of the image
cv2.line(image_shit, (0, h - 1), (w, h - 1), (0, 255, 0), 1)
cv2.line(image_shit, (w - 1, 0), (w - 1, h - 1), (0, 255, 0), 1)

# put the prediction text on top
 # show the output of the prediction with text
print len(predictionList)
print len(centerList)

for (i, predVal) in enumerate(predictionList):
    CORD = centerList[i]
    if predictionList[i] == "other":
        colorFont = (255, 0, 0)  # "Blue color for other"
    else:
        colorFont = (0, 0, 255)  # "Red color for ocean"

    testOrg = (40, 40)  # need this for the if statment bellow

    # for some yet unknown reason CORD does sometime contain somthing like this [[[210 209]] [[205 213]] ...]
    # the following if statment is to not get a error becouse of this
    if len(CORD) == len(testOrg):
        textOrg = CORD
        cv2.putText(image_shit, predictionList[i], textOrg, cv2.FONT_HERSHEY_SIMPLEX, 0.1, colorFont, 3)

    else:
        pass

# show the important shit you did here
cv2.imshow("image_shit", image_shit)
cv2.waitKey(0)


cv2.imwrite("docsIMG/image_shit.png", image_shit)
100
100


True
The image displayed